
#031 - The 7 features that separate modern data platforms from expensive legacy systems
Your complete guide to evaluating data platform capabilities + feature-by-feature implementation roadmap

Your data platform should be accelerating your business decisions, not holding them back.
But here's what's happening in most organisations: you are running analytics on systems designed for yesterday's requirements. Your business users want real-time insights, your data science team needs AI/ML capabilities, and your compliance team demands audit trails that your current system can't provide.
The question isn't whether you need a modern data platform - it's which features will actually move your business forward.
After analysing many platform implementations and modernisation projects, 7 features separate modern platforms from legacy systems. These aren't nice-to-have additions - they're the capabilities that determine whether your data infrastructure becomes a competitive advantage or a bottleneck.
Today, let's break down each feature so you can evaluate exactly what you need and why.
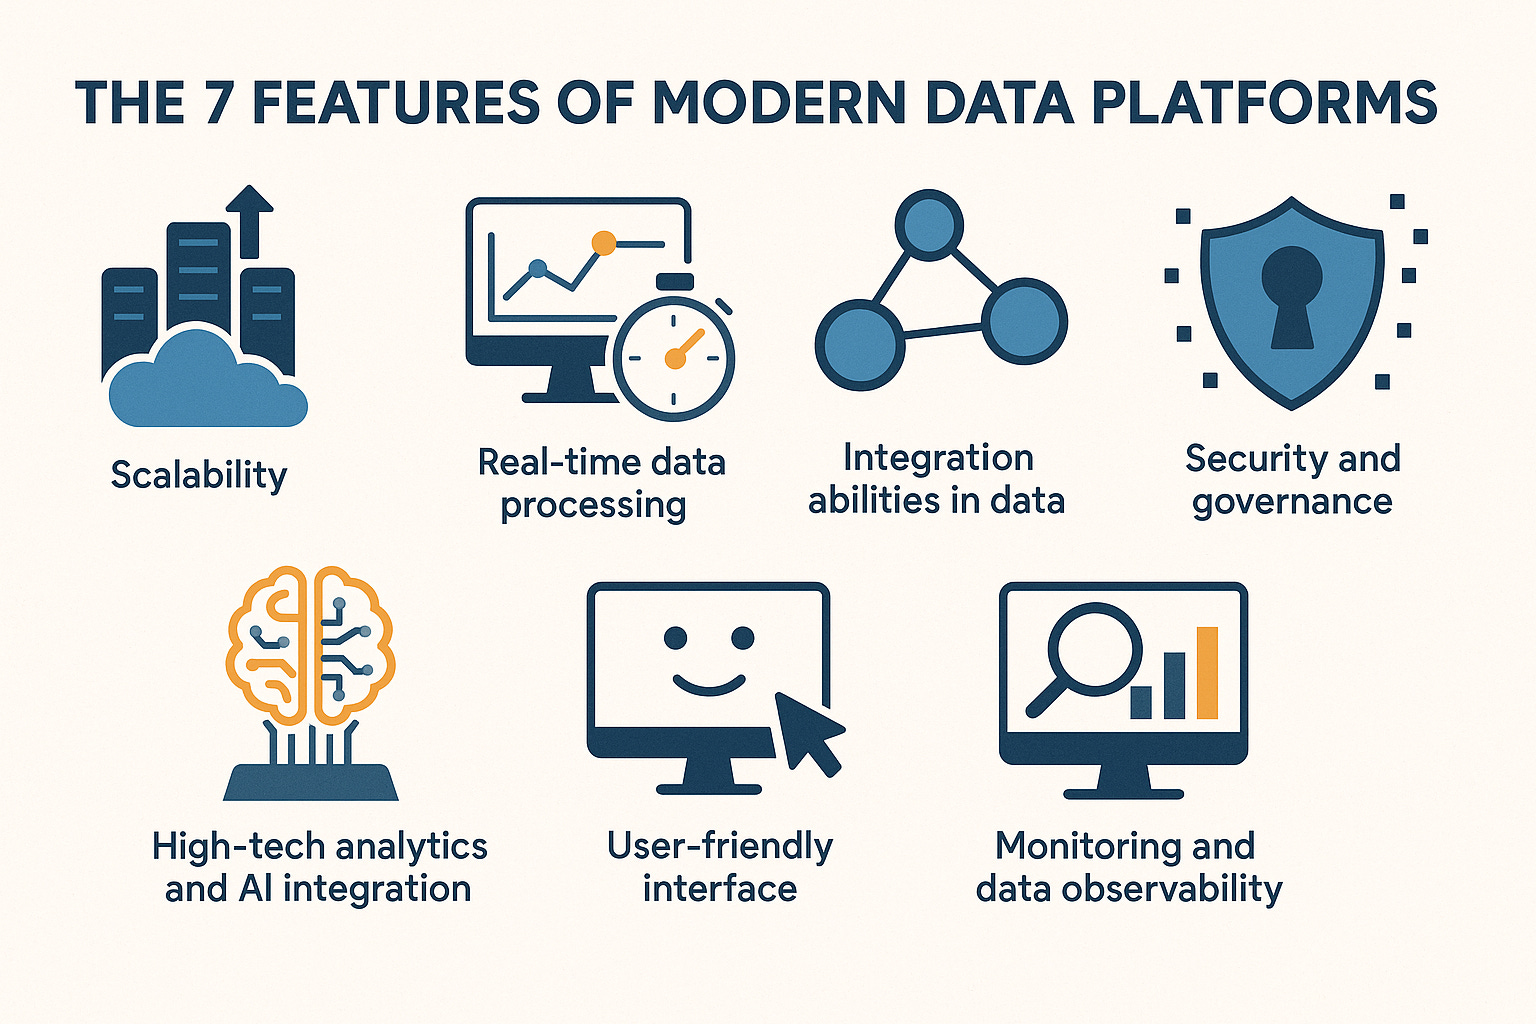
The 7 Features Your Modern Data Platform Must Have
Feature #1: True Elastic Scalability
What this really means: Your platform automatically scales both horizontally (adding more machines) and vertically (adding more power) based on workload demands. Cloud-native architectures that grow and shrink with your needs without manual intervention.
Why it's critical: Your data volumes are exploding exponentially. Today's terabytes become tomorrow's petabytes. Your user base is growing from dozens of analysts to hundreds of business users. Traditional systems hit performance walls that require expensive redesigns.
How to evaluate your current system:
Can you handle 10x more data without architectural changes?
Does performance degrade when multiple teams run analytics simultaneously?
Are you constantly upgrading hardware to maintain performance?
Can you scale down during low-usage periods to control costs?
What good looks like: A marketing team runs campaign analysis during peak season with 500% more data than usual. The platform automatically provisions additional compute resources, maintains sub-second query performance, and scales back down when the campaign ends, without any IT intervention.
Implementation priority: High if you're experiencing performance issues or anticipating significant data growth.
Feature #2: Real-Time Data Processing
What this really means: Stream processing capabilities that analyse data as it arrives through technologies like Kafka, Spark Streaming, or Flink. Moving from batch processing (analyse yesterday's data) to streaming analytics (act on data immediately).
Why it's critical: Competitive advantage often comes from speed of response. Real-time fraud detection saves millions. Dynamic pricing optimisation captures revenue opportunities. Immediate operational alerts prevent system failures before they impact customers.
How to evaluate your current system:
Are you still waiting for overnight batch jobs to see yesterday's results?
Can you detect and respond to anomalies as they happen?
Do you have the ability to trigger immediate actions based on data patterns?
Can you provide live dashboards with current data, not data from hours ago?
What good looks like: An e-commerce platform detects unusual purchasing patterns indicating fraud within milliseconds of transaction initiation, automatically flagging suspicious orders before payment processing completes, preventing both chargebacks and legitimate customer frustration.
Implementation priority: High if you need immediate response capabilities for fraud detection, operational monitoring, or real-time personalisation.
Feature #3: Universal Integration Capabilities
What this really means: Seamless, pre-built connections to virtually any data source - APIs, databases, cloud services, legacy systems, IoT devices, SaaS platforms. Support for all data types: structured (databases), semi-structured (JSON, XML), and unstructured (documents, images) through flexible ETL/ELT frameworks.
Why it's critical: Your data lives everywhere - CRM systems, marketing automation, operational databases, external APIs, partner systems. Modern businesses need to combine all these sources for complete insights, but traditional systems make integration a six-month engineering project for each new source.
How to evaluate your current system:
How long does it take to connect a new data source?
Are you constantly building custom integrations for standard business applications?
Can you easily combine data from different systems for unified reporting?
Do you have pre-built connectors for your most crucial business applications?
What good looks like: A retail company combines POS data, inventory management, customer service tickets, social media sentiment, and weather data to predict demand patterns. New data sources are connected through pre-built connectors in hours, not months.
Implementation priority: High if you're spending significant engineering time on data integration or missing insights because data sources can't be easily combined.
Feature #4: Enterprise-Grade Security and Governance
What this really means: Role-based access controls (RBAC), encryption both at rest and in transit and audit trails, automated compliance support (GDPR, HIPAA, SOX), complete data lineage tracking, and metadata management that shows exactly where every piece of data came from and how it was transformed.
Why it's critical: Regulatory requirements are intensifying, data breaches are increasingly costly, and business users need absolute confidence in data accuracy and compliance. Without proper governance, data becomes a liability rather than an asset.
How to evaluate your current system:
Can you trace exactly where any piece of data originated and how it was modified?
Do you have granular access controls that don't require IT intervention for every permission change?
Can you automatically generate compliance reports for auditors?
Are you confident that sensitive data is adequately protected and access is logged?
What good looks like: A financial services company can instantly provide auditors with complete lineage for any regulatory report, showing every data transformation step, who accessed what data when, and proof that all privacy controls were applied correctly throughout the data lifecycle.
Implementation priority: Critical if you're in a regulated industry, handle sensitive customer data, or need to meet compliance requirements.
Feature #5: Native AI/ML Integration
What this really means: Built-in machine learning capabilities that let data scientists develop, train, and deploy models without moving data to external systems. Support for popular ML frameworks, automated model management, and seamless integration of predictions back into business applications.
Why it's critical: AI is no longer optional; it's competitive table stakes. Your platform should make it easy to experiment with models, deploy them to production, and integrate AI-driven insights into everyday business processes without complex data movement or security risks.
How to evaluate your current system:
Can your data science team build and deploy models without exporting data to external systems?
Are you able to serve real-time predictions to applications and dashboards?
Can you easily retrain models as new data arrives?
Do you have model versioning and performance monitoring capabilities?
What good looks like: A telecommunications company builds churn prediction models directly on their customer data platform, automatically serves predictions to customer service representatives during calls, and continuously retrains models as customer behaviour patterns evolve; all without moving sensitive customer data outside their secure environment.
Implementation priority: High if you're planning AI initiatives, have active data science teams, or want to embed predictive capabilities into business processes.
Feature #6: Self-Service Analytics for Business Users
What this really means: Intuitive, business-friendly interfaces with drag-and-drop analytics, natural language queries, automated insight generation, and visual exploration tools that let non-technical users answer their questions without IT bottlenecks.
Why it's critical: Business users understand their domains better than anyone, but they shouldn't need to learn SQL or wait weeks for IT to build custom reports. Self-service capabilities democratise data access and dramatically accelerate decision-making cycles.
How to evaluate your current system:
Can non-technical users create their own dashboards and reports?
Do business teams wait for IT to answer basic analytical questions?
Are your most data-savvy business users frustrated by system limitations?
Can users explore data visually without writing code or complex queries?
What good looks like: Marketing managers build their own campaign performance dashboards, sales directors create territory analysis reports, and operations teams design custom monitoring views - all without submitting IT tickets or waiting for developer resources.
Implementation priority: High if business users are frustrated with data access limitations or if IT is overwhelmed with report requests.
Feature #7: Comprehensive Monitoring and Observability
What this really means: Real-time monitoring of data pipelines, automated data quality checks, anomaly detection, performance tracking, and complete visibility into system health with proactive alerting when issues occur.
Why it's critical: Data problems compound rapidly and can destroy trust in analytics. You need to detect pipeline failures, data quality issues, and performance problems before they impact business decisions. Trust in data requires confidence in data reliability.
How to evaluate your current system:
Do you know immediately when data pipelines fail or produce unexpected results?
Can you automatically detect when data quality degrades?
Are you monitoring data freshness and completeness across all your sources?
Do you have visibility into query performance and resource utilisation?
What good looks like: A financial services platform automatically detects when transaction data volumes deviate from expected patterns, immediately alerts the operations team, identifies the root cause through detailed lineage tracking, and provides recommended remediation steps - often resolving issues before business users notice any impact.
Implementation priority: Critical for maintaining trust in data and ensuring reliable business operations.
Your Platform Evaluation Scorecard
Rate your current system on each feature (1-5 scale):
Scalability
□ 1 - Frequent performance issues, manual scaling required
□ 2 - Occasional slowdowns, difficult to scale
□ 3 - Generally stable, some scaling limitations
□ 4 - Good performance, mostly automated scaling
□ 5 - Seamless elastic scaling, no performance concerns
Real-Time Processing
□ 1 - Batch-only processing, hours/days for fresh data
□ 2 - Limited streaming, mostly batch-dependent
□ 3 - Some real-time capabilities, mixed batch/stream
□ 4 - Good streaming support, minimal latency
□ 5 - Full real-time processing, immediate insights
Integration
□ 1 - Custom coding required for each new source
□ 2 - Limited connectors, significant development needed
□ 3 - Some pre-built connectors, moderate development
□ 4 - Good connector library, easy integration
□ 5 - Universal connectivity, plug-and-play integration
Security & Governance
□ 1 - Basic security, limited audit capabilities
□ 2 - Some access controls, manual compliance processes
□ 3 - Adequate security, some governance features
□ 4 - Strong security, good governance tools
□ 5 - Enterprise-grade security, automated compliance
AI/ML Integration
□ 1 - No native ML support, external tools required
□ 2 - Basic ML capabilities, limited integration
□ 3 - Some ML features, moderate integration
□ 4 - Good ML support, well-integrated
□ 5 - Native ML platform, seamless AI integration
Self-Service Analytics
□ 1 - Technical skills required, IT-dependent
□ 2 - Limited self-service, mostly technical users
□ 3 - Some business user capabilities
□ 4 - Good self-service tools, business-friendly
□ 5 - Full self-service, intuitive for all users
Monitoring & Observability
□ 1 - Minimal monitoring, reactive problem-solving
□ 2 - Basic monitoring, manual health checks
□ 3 - Some automated monitoring, limited visibility
□ 4 - Good monitoring tools, proactive alerts
□ 5 - Comprehensive observability, predictive insights
Your Total Score: ___/35
Scoring Guide:
30-35: You have a truly modern platform
24-29: Strong foundation with some improvement opportunities
18-23: Significant modernisation needed in key areas
12-17: Platform limitations are likely impacting business agility
Below 12: Critical modernisation required
Implementation Roadmap: Which Features to Prioritise
Phase 1: Foundation (Months 1-4) Start with features that enable everything else:
Security & Governance - Essential for trust and compliance
Monitoring & Observability - Required for reliable operations
Integration - Needed to consolidate data sources
Phase 2: Capability (Months 4-8) Add features that directly impact business users:
Scalability - Ensure performance as usage grows
Self-Service Analytics - Democratise data access
Real-Time Processing - Enable immediate insights
Phase 3: Innovation (Months 8-12) Deploy advanced capabilities for competitive advantage:
AI/ML Integration - Build predictive capabilities
Advanced Analytics - Enable sophisticated use cases
Budget Planning Tip: Most organisations find that investing in governance and monitoring first actually reduces the total cost of other feature implementations.
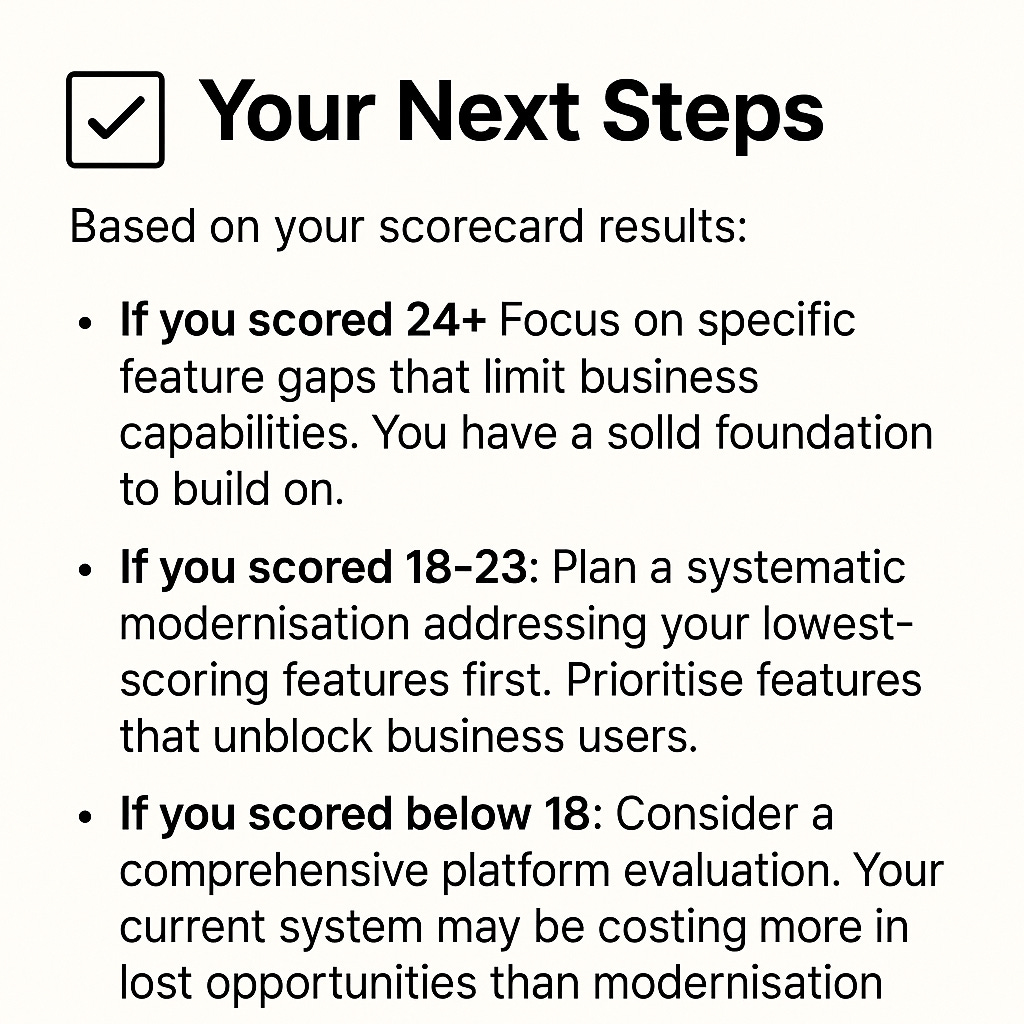
Your Next Steps
Based on your scorecard results:
If you scored 24+: Focus on specific feature gaps that limit business capabilities. You have a solid foundation to build on.
If you scored 18-23: Plan a systematic modernisation addressing your lowest-scoring features first. Prioritise features that unblock business users.
If you scored below 18, consider a comprehensive platform evaluation. Your current system may be costing more in lost opportunities than modernisation would cost.
Immediate actions you can take:
Share this scorecard with your team to build consensus on current gaps
Map each low-scoring feature to specific business impacts
Identify which features would have the highest ROI for your organisation
Use this assessment to structure vendor conversations and demos
Remember: The goal isn't to achieve a perfect score; it's to ensure your platform capabilities align with your business requirements and strategic objectives.
What's Next?
Next week: How to build a compelling business case for data platform modernisation, including ROI calculations that get budget approval and implementation timelines that actually work.
Your turn: Which of these 7 features represents your most enormous gap? What business impact are you experiencing from not having that capability?
Understanding your specific pain points helps determine where to focus modernisation efforts first.
Modern data platforms aren't just about technology; they're about enabling your organisation to make faster, smarter decisions with confidence.
That’s it for this week. If you found this helpful, leave a comment to let me know ✊
About the Author
Khurram, founder of BigDataDig and a former Teradata Global Data Consultant, brings over 15 years of deep expertise in data integration and robust data processing. Leveraging this extensive background, he now specialises in organisational financial services, telecommunications, retail, and government sectors, implementing cutting-edge, AI-ready data solutions. His methodology prioritises value-driven implementations that effectively manage risk while ensuring that data is prepared, optimised, and advanced analytics.